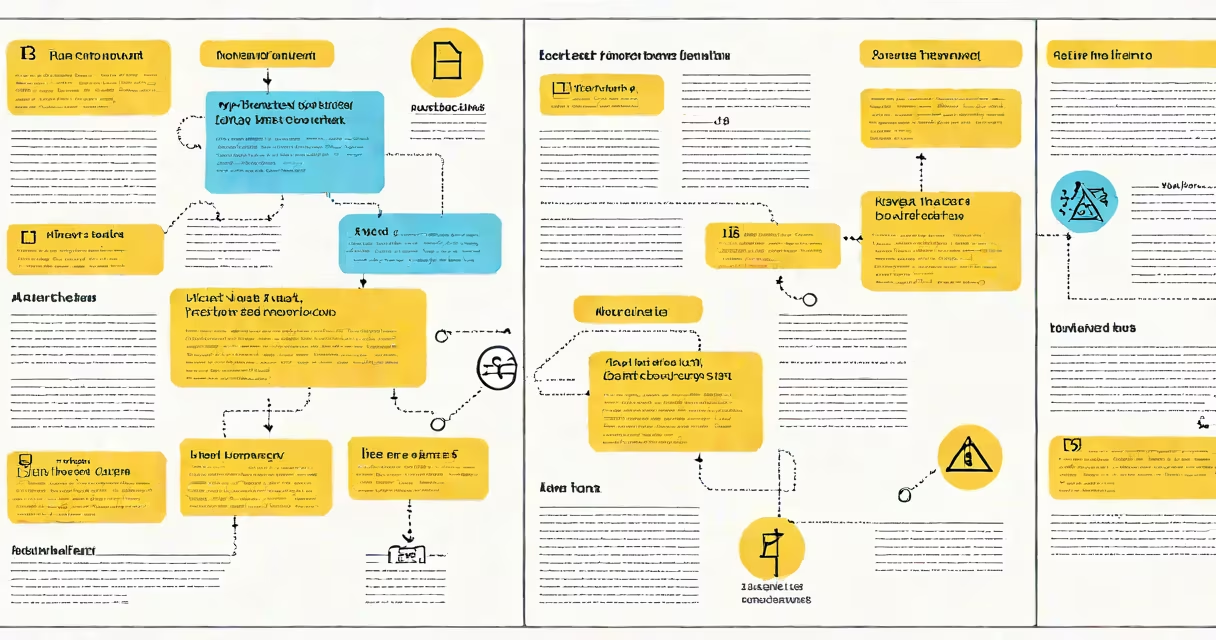
An A3 in lean is a structured problem-solving document that fits on a single sheet of A3-sized paper (11 x 17 inches), designed to communicate a problem, root cause analysis, proposed solution, and implementation plan in a concise, visual format. It supports continuous improvement by aligning teams around a shared understanding of issues and actions.
The A3 originated at Toyota and is central to the Toyota Production System. It is not a template but a disciplined way of thinking-focusing on facts, logical reasoning, and team collaboration. Each A3 report follows a consistent flow: problem statement, current condition, target condition, root cause analysis, countermeasures, implementation plan, and results tracking.
Used widely in manufacturing, healthcare, software development, and service operations, the A3 process ensures decisions are data-driven and solutions are validated before rollout. For example, a hospital reduced patient wait times by 35% after a nursing team documented their workflow bottlenecks on an A3, then tested changes in pilot units.
The A3 process begins with a clear, measurable problem statement. Instead of saying "We have long wait times," a proper A3 states: "Emergency room patients wait longer than 60 minutes for initial triage, averaging 87 minutes." This specificity enables focused action.
Next, the team gathers data on the current condition-what's actually happening. This includes metrics, timelines, and direct observation. At a factory, a team noted that machine downtime occurred most frequently between 2:00 PM and 4:00 PM, correlating with shift changeover delays.
After analyzing causes-using tools like the 5 Whys or fishbone diagrams-the team proposes countermeasures. These are tested in small cycles (Pilot Phase), then refined. The final step is defining the implementation schedule, responsibilities, and success criteria. Results are tracked over time to confirm impact.
Each A3 report contains six core sections:
These sections are arranged in a logical sequence, often left to right, top to bottom, to guide the reader through the logic. Visuals-charts, photos, timelines-are embedded to reduce ambiguity. A poorly constructed A3 may include vague language or missing data points, undermining credibility.
Many organizations treat the A3 as a form to fill out rather than a thinking tool. This leads to reports that look correct but lack depth. A real A3 requires engagement: team members must observe, question, and validate assumptions together.
Another mistake is assuming the A3 is only for production teams. While it originated in manufacturing, A3s are equally effective in IT, finance, and HR. A software team used an A3 to reduce deployment failures by 60% after identifying configuration drift during release cycles.
A less obvious error is skipping the follow-up phase. An A3 isn't complete until results are measured and lessons are captured. According to the Lean Enterprise Institute, 40% of A3 initiatives fail due to poor execution tracking, not flawed planning.
A3 reports fall into three primary categories based on purpose:
| Type | Purpose | Best For | Example |
|---|---|---|---|
| Problem Solving | Address a specific operational issue | Production line stoppages, customer complaints | Reducing defective parts by 20% in assembly |
| Project Planning | Outline steps for implementing a new initiative | New product launches, system upgrades | Rolling out a new inventory management system |
| Continuous Improvement | Track ongoing enhancements | Process standardization, waste reduction | Reducing setup time across five machines |
Each type uses the same structure but emphasizes different sections. A project planning A3 focuses heavily on milestones and resource allocation. A continuous improvement A3 highlights baseline data and performance trends.
In 2021, a clinic in Portland faced rising patient no-show rates-averaging 28% for specialist appointments. The team created an A3 to investigate. They discovered that 62% of missed appointments were due to unclear appointment reminders sent via email only.
They gathered data: 43% of patients accessed their health portal on mobile devices, but reminder emails weren't optimized for mobile view. The target condition was reducing no-shows to under 15% within three months.
Countermeasures included switching to SMS reminders (which had a 98% open rate), adding calendar invites, and sending a follow-up text 24 hours before the visit. The team piloted the change with 50 patients and saw a drop to 12% no-shows.
After validation, they rolled out the process across all specialty departments. Six weeks later, the no-show rate fell to 14%. The A3 was updated with results and shared in the monthly operations review.
The A3 is not just a document-it's a cultural artifact. It embodies the principles of respect, transparency, and continuous learning. When leaders walk through a facility and see A3s posted on walls, they're seeing evidence of frontline problem solving.
According to the Institute for Healthcare Improvement, hospitals using structured problem-solving methods like A3 reported 30% faster resolution of care delivery issues compared to those relying on informal meetings.
I've seen teams struggle with A3s when they skip the fieldwork. Once, a team submitted an A3 claiming "employee turnover is high" without visiting the floor or talking to staff. The report lacked context. After observing shifts and interviewing workers, they revised the problem statement to focus on onboarding gaps-leading to a 40% reduction in early resignations.
When done well, an A3 in lean becomes a living record of improvement. It's not a one-time exercise but a recurring practice. Teams revisit A3s quarterly to assess outcomes and update plans.