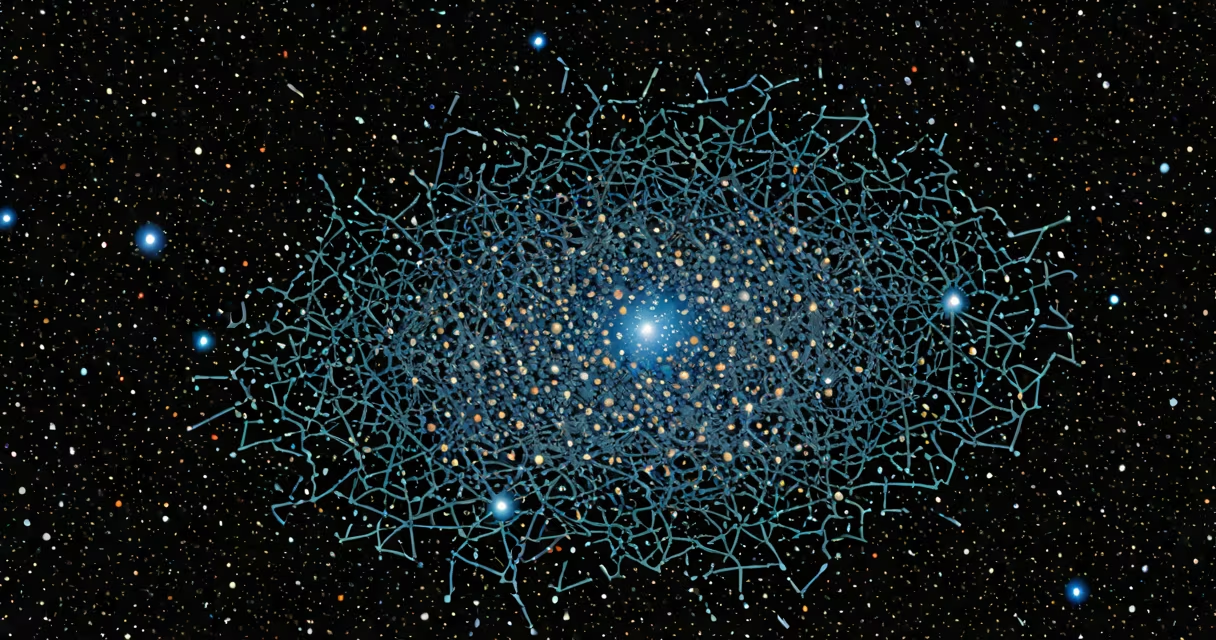
A map of the universe plots the positions of galaxies, galaxy clusters, and vast empty regions called voids across billions of light-years, based on observations from telescopes and surveys. It reveals large-scale structures like filaments, sheets, and cosmic voids formed by gravity and dark energy over 13.8 billion years.
These maps are not literal photographs. They are reconstructed from redshift measurements, which indicate how much light from distant galaxies has stretched due to the expansion of space. Redshift values correlate with distance, allowing astronomers to assign 3D coordinates to millions of galaxies. The Sloan Digital Sky Survey (SDSS) and the Dark Energy Survey (DES) provide the primary datasets.
For example, the Cosmic Web-filamentary structures connecting galaxy clusters-was confirmed through the SDSS's Baryon Oscillation Spectroscopic Survey (BOSS). BOSS mapped over 1 million galaxies between 2009 and 2014, revealing that galaxies are not randomly distributed but form a web-like pattern. The largest known structure, the Hercules-Corona Borealis Great Wall, spans 10 billion light-years and was identified from redshift data in 2013.
Scientists begin with telescope data from optical, infrared, and radio wavelengths. Instruments like the Hubble Space Telescope and the James Webb Space Telescope detect visible and near-infrared light from distant galaxies. These signals are cross-referenced with spectroscopy, which splits light into spectra to measure redshift.
Redshift (z) is calculated using the formula: z = (λ_observed − λ_rest) / λ_rest. A z value of 0 means no shift; z = 1 means the wavelength doubled. For z = 6, light has stretched by a factor of 7, indicating the galaxy formed 13 billion years ago. This allows researchers to place galaxies in time and space.
Once redshifts are measured, data is projected onto a 3D grid. Software like Healpix and Python libraries such as Astropy handle coordinate transformations. The result is a volumetric map showing density variations-high-density areas become clusters, low-density zones become voids.
Different surveys focus on different scales and depths. The following table summarizes major projects:
| Survey | Field of View | Depth (Redshift) | Galaxies Mapped | Primary Use |
|---|---|---|---|---|
| SDSS (BOSS) | 14,000 square degrees | z ≈ 0.1-0.5 | 1.2 million | Large-scale structure, baryon oscillations |
| Dark Energy Survey (DES) | 5,000 square degrees | z ≈ 0.5-1.5 | 300 million | Dark energy, weak lensing |
| Euclid (planned) | 15,000 square degrees | z ≈ 0.2-2.0 | 2 billion | Dark matter, galaxy evolution |
Each map type emphasizes different physics. BOSS focuses on baryon acoustic oscillations-ripples from the early universe that left imprints in galaxy clustering. DES uses weak gravitational lensing to infer dark matter distribution. Euclid will combine both methods to refine cosmological models.
Many assume a map of the universe shows everything. That's false. The observable universe is limited to ~46.5 billion light-years in radius due to the finite speed of light and the age of the universe. Anything beyond that cannot be seen, even with future telescopes.
Another error is thinking maps show the universe's current state. They don't. They show how galaxies were distributed at various times in the past. A galaxy at z = 3 appears as it did 12 billion years ago. The map is a timeline of cosmic growth, not a snapshot.
Some confuse the map with the actual layout of stars. Stars are too small and too close together to appear individually. Maps show galaxies-collections of 100 billion stars-as points. The scale is immense: a single pixel in a typical map represents a region 10 million light-years wide.
I once visualized a slice of the SDSS data using Python and Matplotlib. After loading galaxy coordinates and redshifts, I applied a color gradient based on redshift. The resulting 3D plot revealed dense filaments stretching across the sky, with voids appearing as dark gaps. The pattern matched theoretical predictions from Lambda-CDM cosmology.
This visualization helped me grasp how gravity pulled matter into filaments while dark energy pushed space apart. The map isn't just data-it's evidence of forces shaping reality. It confirms that the universe is not uniform but structured, with clusters forming along cosmic filaments.
When interpreting a map of the universe, remember: it's not a static picture. It's a reconstruction of history, built from light that traveled for eons. The most accurate version we have comes from combining multiple surveys and correcting for observational biases like selection effects and foreground dust.
Understanding a map of the universe requires accepting that we see the past. The light from the most distant galaxies left before Earth existed. Yet, by measuring redshift and combining data from surveys like DES and BOSS, scientists build a coherent model of cosmic evolution. This model underpins our understanding of dark matter, dark energy, and the ultimate fate of space-time.
As new missions like Euclid launch, maps will grow sharper. Future versions may include neutrino backgrounds, gravitational wave events, and high-redshift quasars. But even today's maps reveal a cosmos shaped by invisible forces and ancient collisions. The map of the universe is not just a tool-it's a window into the origin and architecture of everything we can observe.